It is the former British Prime Minister, Benjamin Disraeli, who is famously credited with the phrase: ‘There are three kinds of lies: lies, damned lies, and statistics’, but the expression has been around almost as long as the word statistics (first coined in 1749 for those wondering). It is a phrase describing the persuasive power of statistics to bolster weak arguments. It is also sometimes colloquially used to doubt statistics when they’re used to prove an opponent’s point. We know that statistics can, and are, used depending on the person using them, for whatever means they are trying to achieve.
The 2021 Australian Bureau of Statistics (ABS) Census data was released earlier in the month with much fanfare and interest. I realised that ‘stats’ were no longer just for nerdy demographers anymore when it was a hot topic of discussion around the dinner table with our Millennial children and their partners. Oh, how things have changed!

Clunky and boring
The first Census data that I worked on was thirty years ago when I was working in Byron Shire Council as a Town Planner/ Community Projects Officer and developed the Council’s first Community Profile: August 1992. No one was much interested in the 1986 and 1991 statistics then. The data was clunky and difficult. It was boring. People who looked at statistics were considered boring. There was very little comparative data. There was little to no analysis provided by the ABS. The information was basic. I still have that profile. It is interesting reading after all these years.
Having lived in Byron Shire for 40 years, the most common refrain from newcomers is, ‘Oh, you must have seen so much change.’ Of course, Byron was never going to stand still. The 1986 and 1991 Census data began to show just how Byron Shire was changing.
Inward migration
At that time Byron Shire became one of the most rapidly growing shires in NSW. The region had undergone the highest proportional growth, in terms of population, out of any region within NSW between 1981 and 1989, excluding the Sydney Metropolitan Region. Inward migration was principally responsible for this growth. Suffice to say, the Community Profile was not common reading outside of Council or the NSW State government. There weren’t the numerous cafes with barista-made coffee that there are now, with people sitting around discussing all manner of Byron topics.
The reason for the development of the profile was to provide information for a NSW State government program called the NSW Area Assistance Scheme (AAS). The AAS was established on the north coast of NSW in 1991 in recognition that the north coast had a deficiency in physical and community services, primarily as a result of the region’s rapid population growth. The introduction of a similar scheme had begun in Western Sydney in 1979, and was extended in 1985 to include the Hunter, Illawarra, Macarthur and the Central Coast regions. There were a number of reasons for this scheme: to increase awareness of local and regional needs and promote regional resource planning and co-ordination; to promote the equitable distribution of resources within the region; and to aid co-operation and co-ordination between all agencies involved in community development.
Based on statistics – such as the number of sole parent families, unemployment rates, income levels, housing ownership – governments allocated funds where social infrastructure was needed.
The Seachange Shift
The wider public’s interest in statistics was piqued when Bernard Salt came on the scene in the ’90s and popularised demographics by providing descriptions as well as analysis of the Census data. He coined the now oft-used phrase ‘seachange’ and wrote a book, Seachange Shift about it. He labelled towns and cities in a way that made people, other than nerdy demographers, take notice. I still remember being at a seminar held in Lismore where he described Dubbo as a doughnut city, meaning that the population from the city centre had decreased substantially, but the bit around the edges had filled out. It was memorable, evocative language.
Much later ‘profile.id’ came along as a website census database that provided useful Census data by Local Government Area (LGA), and then began to also include analysis. Statistics in and of themselves don’t really tell us what we need to know about a place. It’s how the numbers are put together; how they are compared to previous years’ and compared to other places, which gives them meaning. Profile.id did this well so that people like me didn’t need to develop community profiles for council areas anymore.
Byron Shire stats
More and more people were looking at the census data and looking at what it meant. Which brings us to now, when ABS census data has become of interest to millennials. What was their interest? Notably, in Byron, 57.7 per cent of persons ticked ‘no religion’, compared with 32.8 per cent for NSW and 38.4 per cent for Australia; 19.5 per cent of persons did voluntary work through an organisation or group, compared with 13 per cent for NSW and 14.1 per cent for Australia; unoccupied private dwellings comprised 15.4 per cent, compared to 9.4 per cent for NSW and 10.1 per cent in Australia; gGroup households comprise 8.9 per cent, compared with 3.8 per cent for NSW and 3.9 per cent in Australia. Further to this, 50.2 per cent of renter households have rent payments greater than 30 per cent of household income, compared with 35.5 per cent in NSW and 32.2 per cent in Australia.
So, what does this all mean? Well, a whole lot more looking at the data to see how the Shire has progressed and regressed in terms of housing affordability and availability.
The 2021 Census
While the 2021 Census does take into account the 2020 covid year, it doesn’t take into account the catastrophic floods that occurred in the Northern Rivers in 2022; mainly affecting Lismore and Murwillumbah, but including parts of Byron Shire, and bound to make significant changes to the demography of the region as a whole. Anecdotally, some people from Sydney and Melbourne who took up residence during covid are heading back to the cities. Their offices are calling them back. Trickling in are overseas visitors.
Prior to covid, Byron Shire experienced approximately 2.7 million tourists per year. The total estimated resident population then was 31,556 persons. Byron Bay, which bears the brunt of the tourism visitation, was just 5,521 persons. It’s a small town after all, whose residential population hasn’t really changed in numbers all that much over these years. Byron, its Indigenous language name Cavanbah, has always been a meeting place, according to the local Indigenous people. Ancient tribes/ clans came there to meet and eat.
It has always been a transient place, where people come and go, come and eat and go. Just as well, as it is an expensive place to live. The Census data tells us that too.
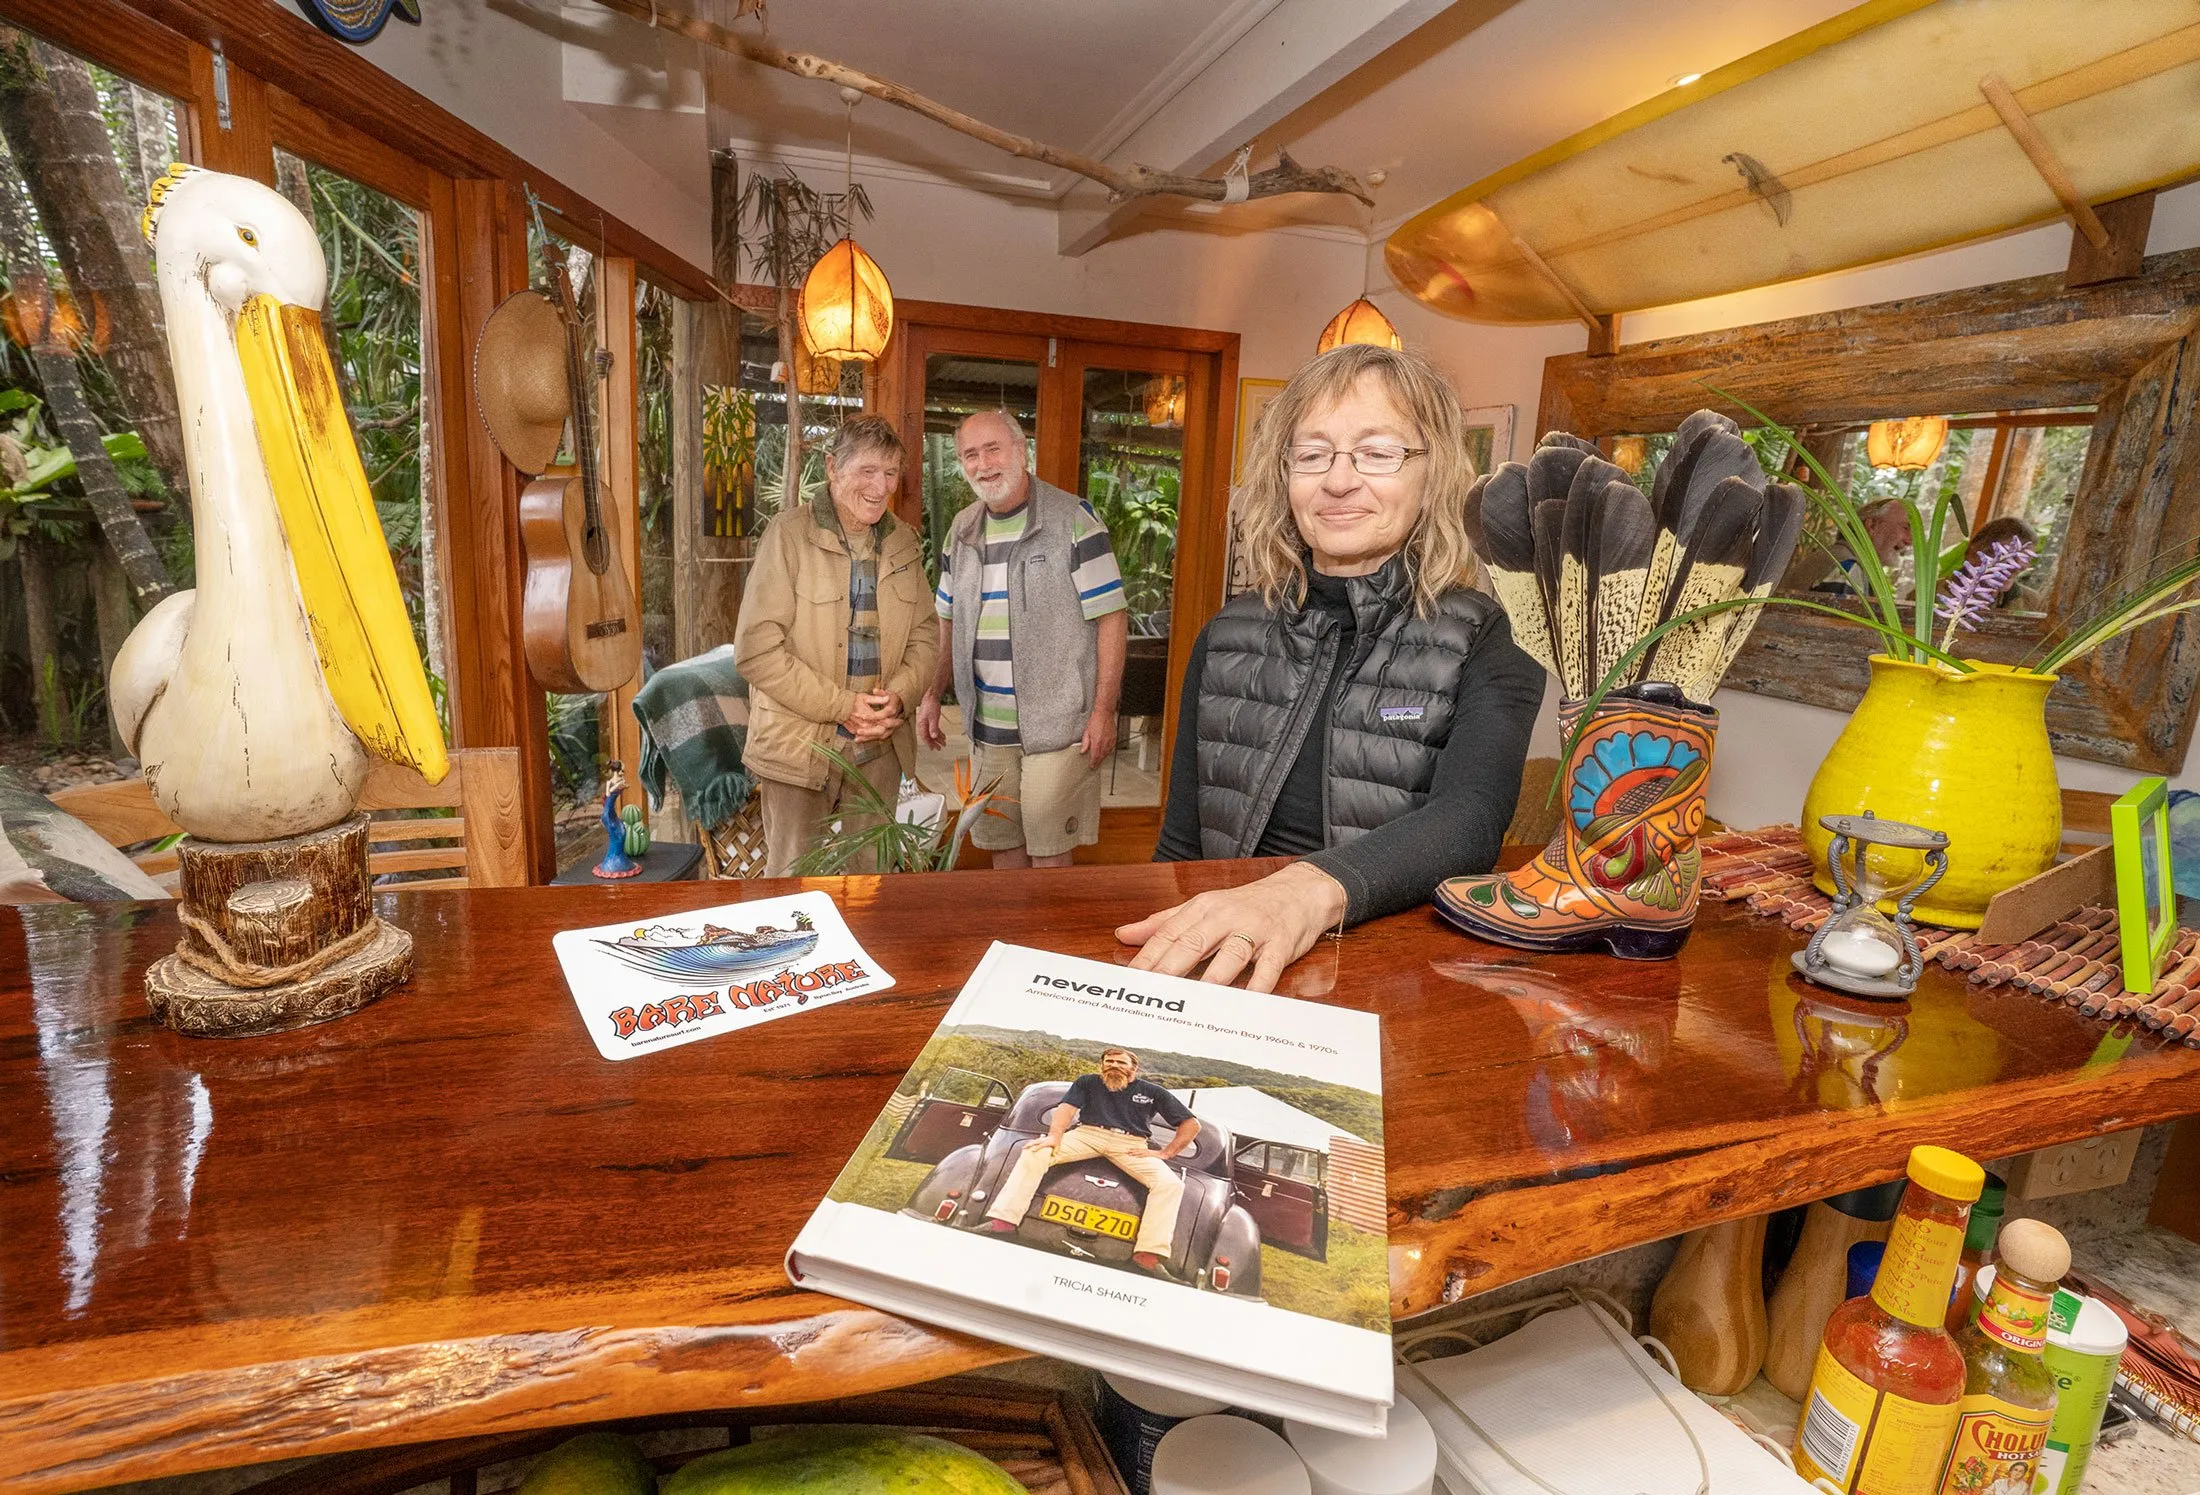
Tricia Shantz is the author of the soon-to-be-released book Neverland: American and Australian Surfers in Byron Bay in the 1960s and 1970s.
 For four decades The Echo has printed the stories some people loved, some people hated, and some pretended not to read. If you want us to keep telling the truth, the real truth, not the sugar-coated version. We’ll need your support to keep the presses rolling.